
In a nutshell: Ever feel overwhelmed by the sheer number of TV shows and movies available today? That's because, as of December 2019, there were 646,152 unique program titles available on traditional linear and streaming services, 10 percent more than in 2018.
The figures come from Nielsen's Total Audience Report---the first to use smart TV data from Gracenote. Of the near 650,000 unique programs, around 9 percent appeared exclusively on SVOD (subscription video on demand) services.
"The proliferation of on-demand streaming services is the most profound media disruption of the last half-century," wrote Peter Katsingris, Nielsen's senior vice president of Audience Insights. "And this disruption is driving profound, real, actionable opportunity across all facets of the industry."
Nielsen found that 73 percent of US households now have some form of video streaming subscription service, and 33 percent have three or more of these services.
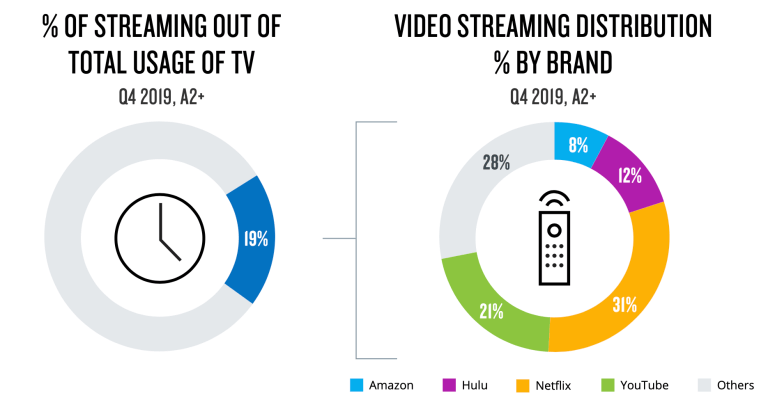
The report states that in homes capable of OTT streaming, 19 percent of their TV time was spent watching streaming during Q4 2019. Not too surprisingly, Netflix was the most popular choice among these services, accounting for 31 percent of viewing time. It was followed by YouTube (21 percent), Hulu (12 percent), and Amazon (8 percent). Other services accounted for 28 percent.
Consumers' love of streaming isn't slowing down. Ninety-three percent of video subscribers said they would either maintain their current number of subscriptions or get more, while almost half of those aged 18 to 34 have three or more services. Disney+, meanwhile, attracted 28.6 million subscribers in under three months.
Consumers spent around $600 million on video and audio content in 2019. By 2023, the figure is expected to reach $1 trillion.

It seems we're now addicted to our devices more than ever, with the average consumer spending 11 hours and 54 minutes every day interacting with TVs, smartphones, consoles, and more. Using apps or accessing the web on our smartphone takes up most of this time (3:58), followed by watching live TV (3:27). We spend almost 90 minutes more on digital media content than we did last year, and an entire day longer compared to six years ago.