
What just happened? Nvidia has launched a free benchmarking tool called FrameView that lets users know how their GPU is holding up by claiming to accurately measure frame rates, frame times, power usage, performance per watt and other metrics. Interestingly, the tool also supports and records performance stats from rival AMD GPUs with power consumption being an unreliable value because of how its reported by AMD's API. The Windows only tool works across almost all games as it supports titles built with major APIs including DirectX 9, 10, 11 and 12, OpenGL, Vulkan and UWP.
Nvidia thinks that you should use its new FrameView tool (currently in beta) to assess the performance and power usage of your GPU. The company says it's important that GPU benchmarks are measured accurately because they are likely to be used as research by prospective buyers or users who want to know how their card is holding up.
Rather than using multiple tools to capture data, Nvidia's FrameView integrates with the "notoriously-complicated" PresentMon to collect over 30 analytics and cover all important metrics like frame rates, frame times, power usage, performance per watt, etc. "To date, no single tool or app has accurately delivered these results, which is why we've created FrameView, an all-in-one benchmarking app that you can download and use for free."
The tool is meant to be lightweight and have minimal impact on performance during benchmarking. The "integrated overlay enables you to view performance and stats during gameplay, and it's vendor agnostic, too, enabling the collection of detailed, comparative data." Nvidia notes that AMD's power consumption value measured through its tool will not be accurate as the latter uses an API that "reports a value in-between chip power and board power, rather than the true values."

Nvidia claims that its engineers have been able to greatly reduce the use of system resources during performance monitoring that usually affect the recorded results. It shows two important metrics for Performance Testing called the Rendered Frame rate and Displayed Frame rate. The former is used to indicate "the smoothness of the animation delivered to the GPU" as the tool captures and reports timestamps at the start of the graphics pipeline, while Displayed Frame rate reports timestamps at the end of the graphics pipeline indicating the number of frames being finally displayed on the user's screen.
FrameView also reports on the 90th, 95th and 99th Percentile Frame rates for a game with the last metric mostly used as a measure of its smoothness and consistency. In terms of power testing, the tool shows three metrics, CHP, TGP and PPW. CHP is the power consumption in watts of the GPU chip only. TGP, on the other hand, shows total watts consumed across the chip and the board, ignoring any power draw through the GPU's USB-C output. PPW or Performance per Watt, as indicated in the name, reveals how many frames you're getting for watts consumed in seconds, across the chip and board (TGP). Users who want to view PPW while considering CHP can refer to the log files generated by the tool.
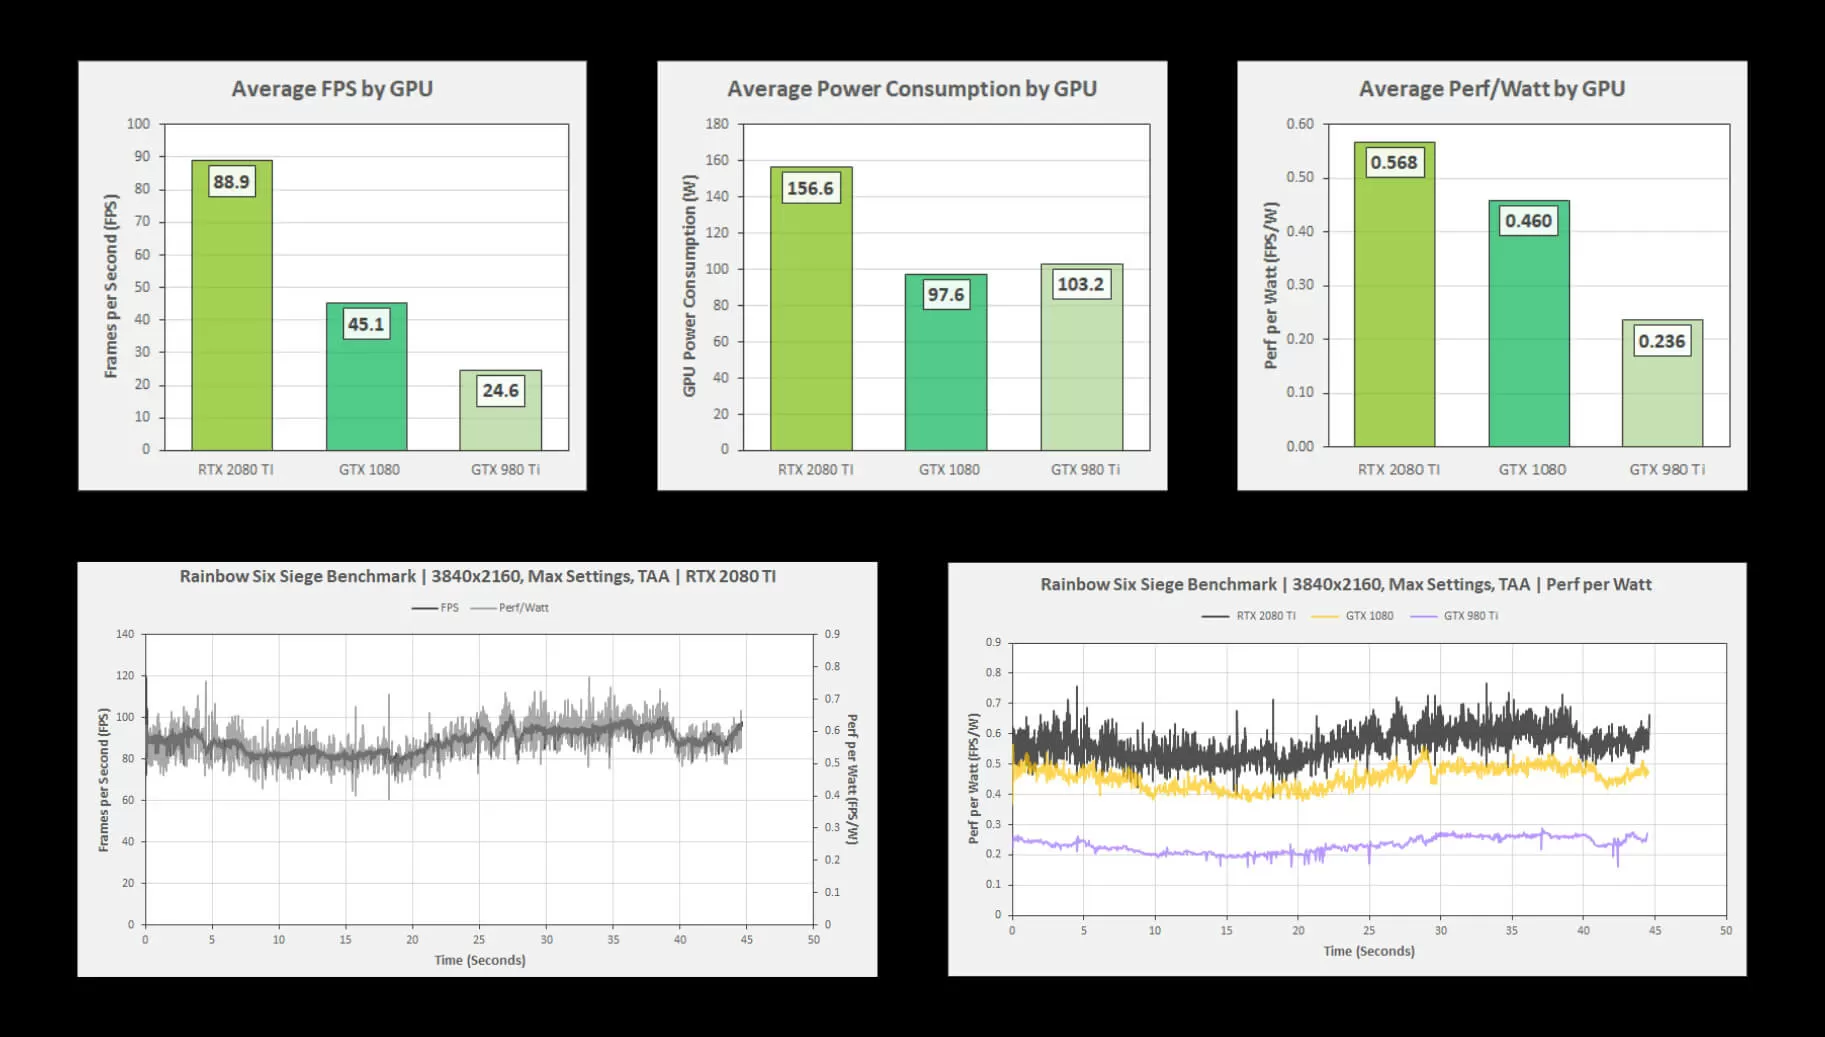
FrameView's output can be viewed in Excel or a similar application and "with some charting knowledge" users can "quickly turn the long lists of data into readable graphs, with optional comparative data, enabling quick and easy viewing of performance per watt, frame rates, and other data points," notes Nvidia, with plans to add more features and options to FrameView in future versions.